tracing=True instruments supported agent, team, and workflow operations. Each instrumented run produces spans for model calls, tool executions, team coordination, and workflow steps. AgentOS writes the aggregate trace to agno_traces and individual spans to agno_spans.
Where trace data goes
The built-in exporter writes trace records to the database you configure:
Tracing does not change where models and tools send data. An agent can still call external model providers, tools, or exporters. Trace attributes can contain prompts, tool arguments, and model output, so apply the same access and retention controls you use for other sensitive application data.
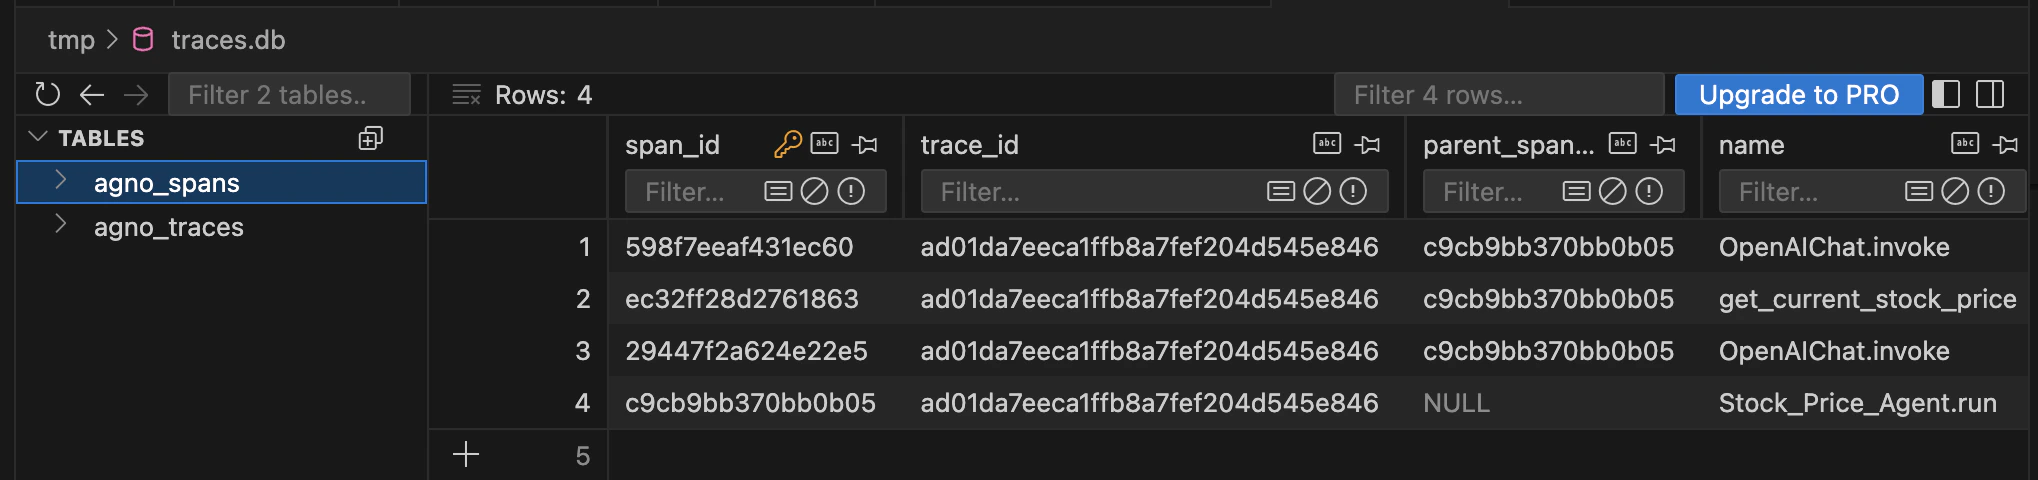
Traces stored in your own database, viewed in a SQL client
What gets captured
Each record inagno_spans stores the span name, parent, status, timestamps, duration, and an attributes JSON object. The aggregate row in agno_traces stores the run, session, user, and component IDs when present, plus overall status, start and end times, and duration.
Traces follow OpenInference semantic conventions, so you can query them directly:
PostgresDb creates its tables in the ai schema by default (override with PostgresDb(db_schema=...)). Qualify the table as ai.agno_spans or add ai to your search_path.
In the AgentOS UI
The control plane renders the same traces visually. Click a run to see the full tree: LLM hops, tool calls with their inputs and outputs, and sub-agent traces. Filter by user, session, or time range.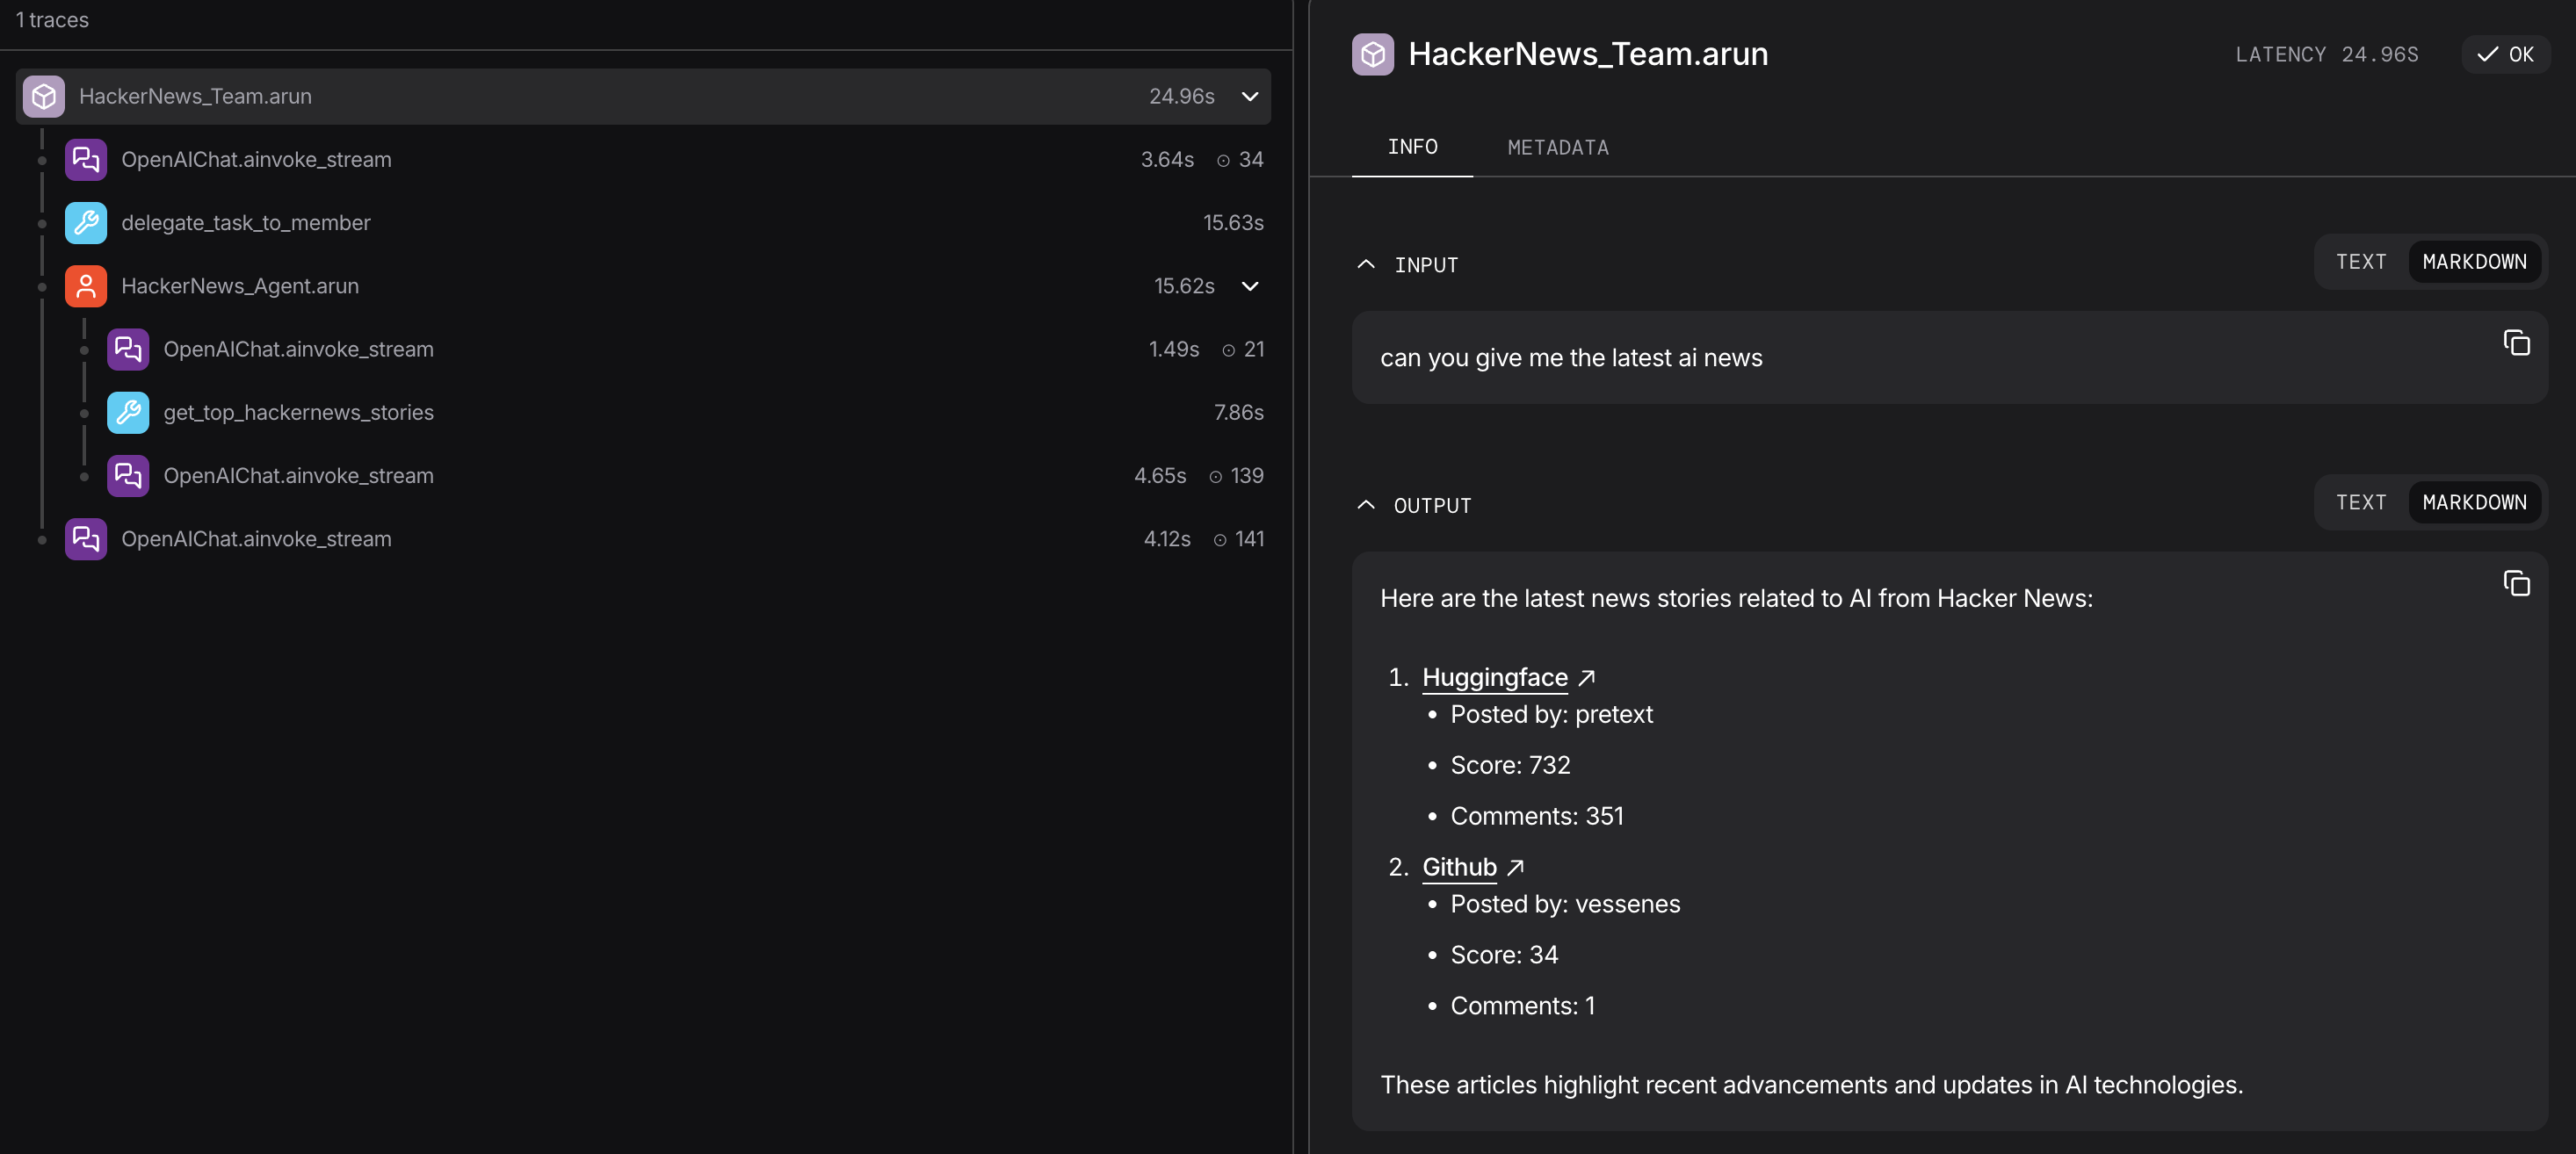
The same traces, rendered in the AgentOS control plane
Multi-database tracing
Traces are high-volume and write-heavy, with a different cost profile, retention, and access pattern than sessions. For production, route them to a dedicated database by pointing the AgentOSdb at it:
db is where traces land. Keeping it separate isolates trace write volume from your agent data and gives you independent retention and scaling.
See Multi-DB tracing for the setup_tracing() variant with batch tuning.