Overview
The Tracing feature in AgentOS provides deep observability into your agent and team executions. Every run generates a trace containing detailed information about what happened, how long it took, and what resources were used.- Traces capture the complete execution flow of agents and teams
- Each trace contains spans representing individual operations (LLM calls, tool executions, etc.)
- Each span contains token usage (when relevant), latency, and error information at a glance
- You can filter and search traces to debug issues or analyze performance
Prerequisites: Your AgentOS must be connected and active with tracing enabled. If
you see “Disconnected” or “Inactive,” review your
connection settings.
Accessing Tracing
- Open the
Tracingsection in the sidebar. - Click the
Refreshbutton to sync the latest traces.
Filtering Traces
Use the filtering options to quickly find the traces you need:View Mode
- By Session - Group traces by conversation session to see all activity within a session
- By Run - View individual execution runs to analyze specific interactions
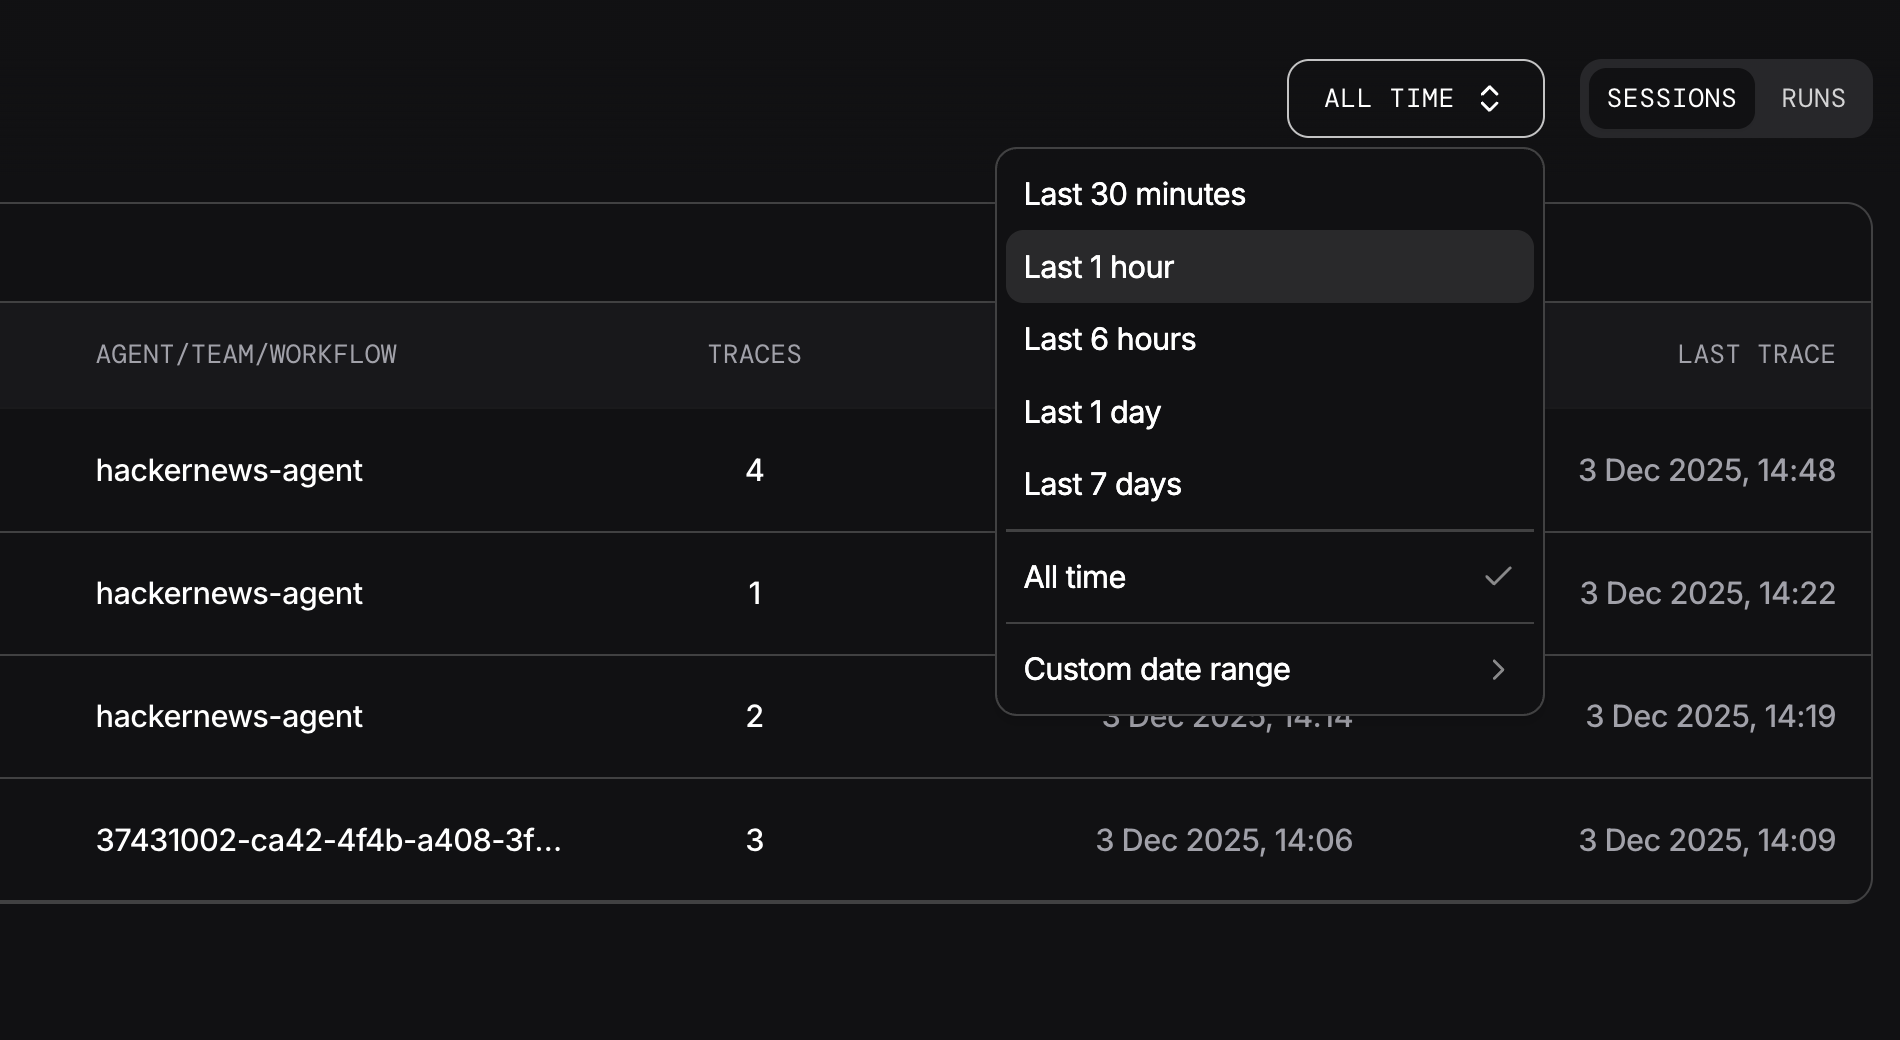
Time Range
- Quick filters - Select from preset ranges: last hour, last 24 hours, or last 7 days
- Custom range - Pick specific start and end dates for precise time-based filtering