Why is Observability Important?
As your Agno system become more complex (Agents using multiple tools, making sequential decisions, and coordinating with other agents), understanding its behavior becomes challenging. Agno Tracing solves this:- Debugging: See exactly what went wrong when an agent fails
- Performance: Identify bottlenecks in agent execution
- Cost Tracking: Monitor token usage and API calls
- Behavior Analysis: Understand decision-making patterns
- Audit Trail: Track what agents did and why
All Agno Tracing data is stored in your own database. No tracing data will leave your system, or be sent to third parties: you are in complete control.
Understanding Traces and Spans
Think of tracing like a family tree for your agent’s execution:Trace
A trace represents one complete agent execution from start to finish. Each trace has a uniquetrace_id that groups all related operations together.
Span
A span is a single operation within that execution. Spans form a parent-child hierarchy: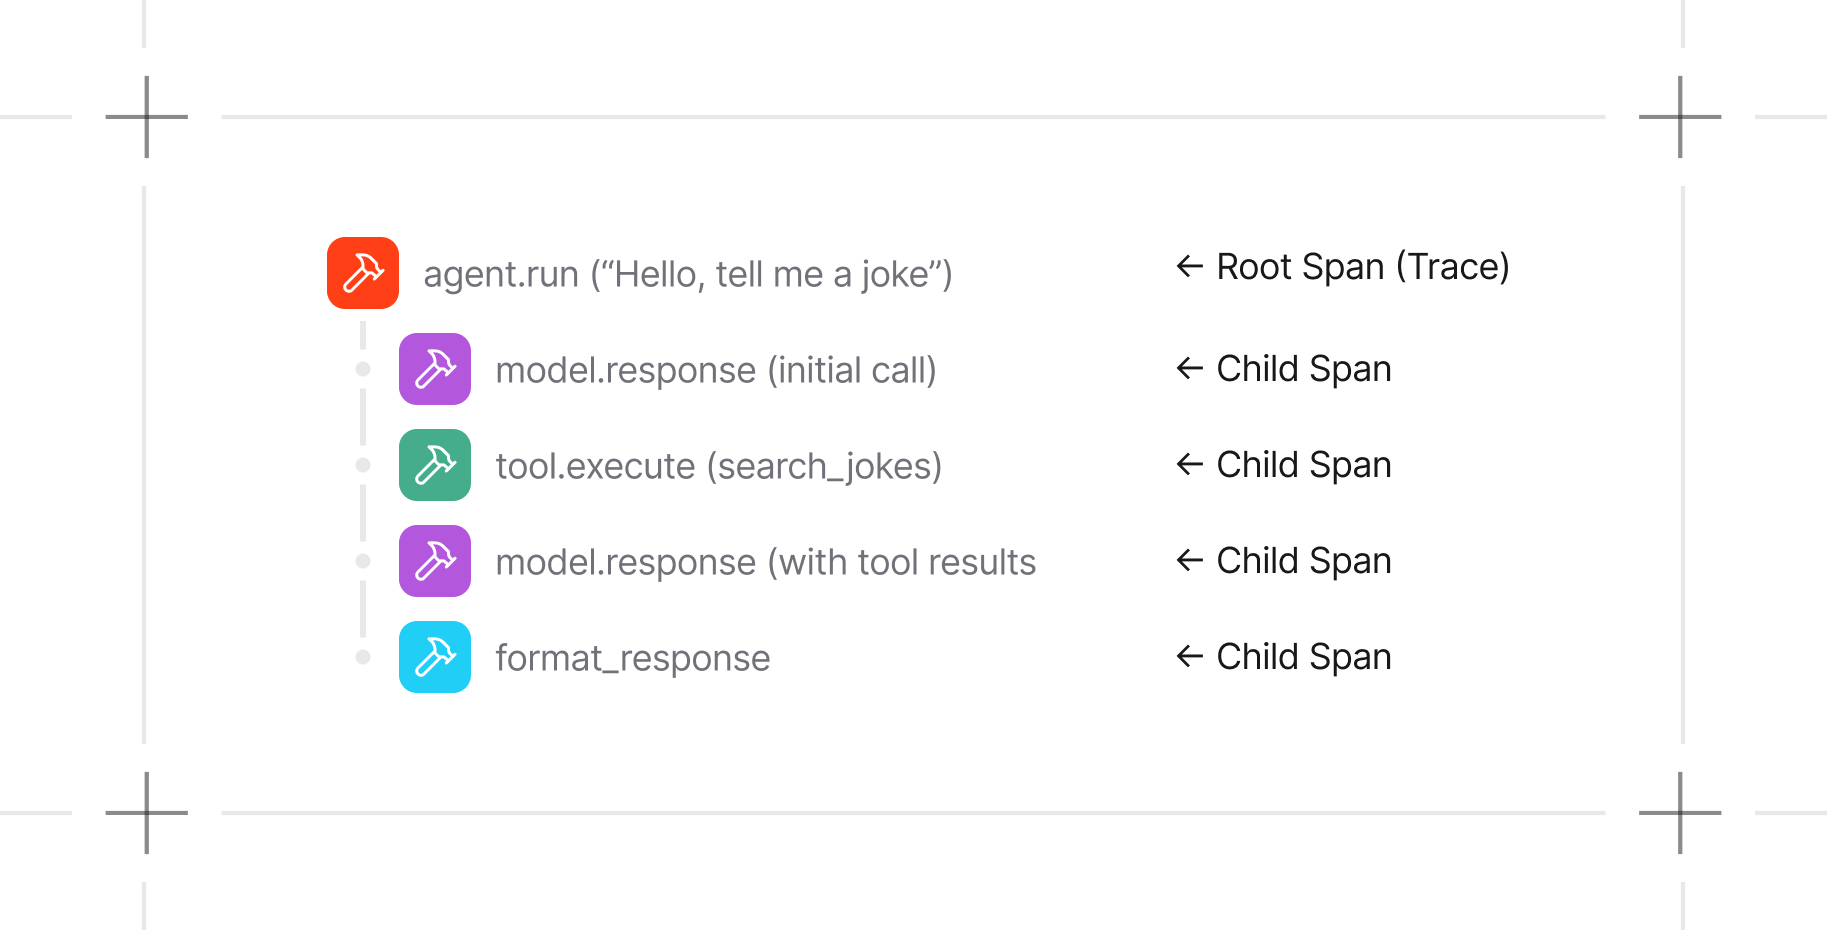
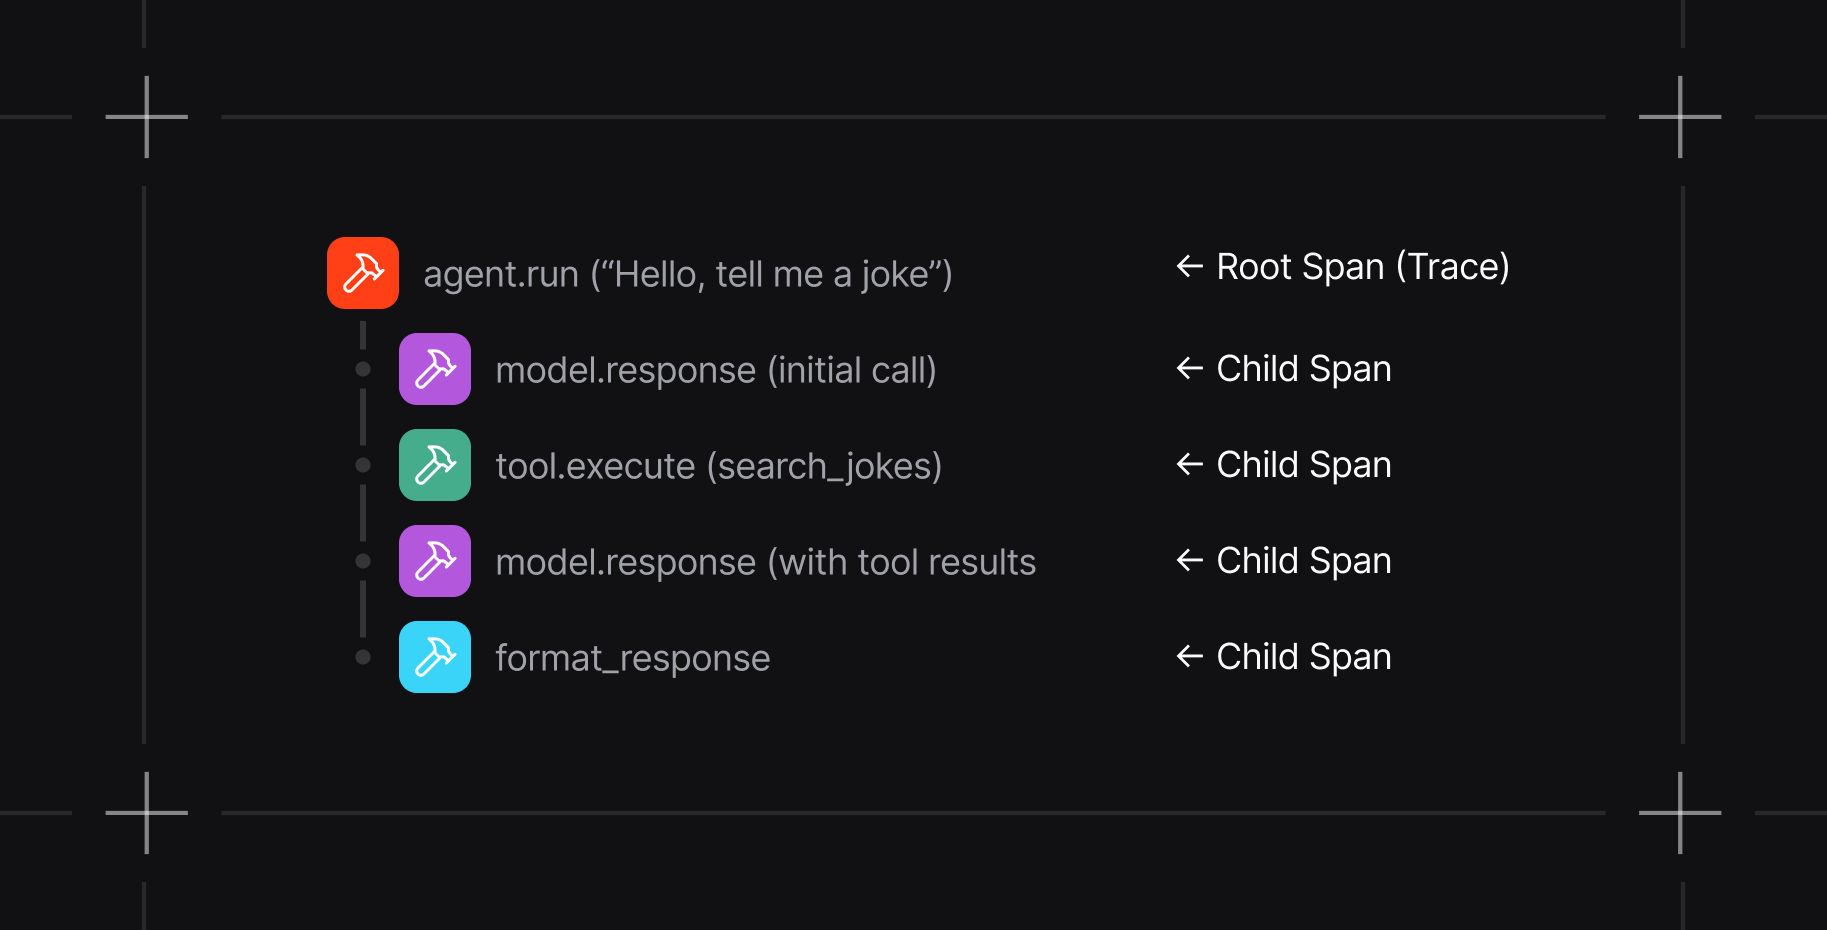
- What happened: Operation name (e.g.,
agent.run,model.response) - When: Start and end timestamps
- Context: Input arguments, outputs, token usage
- Relationships: Parent span, child spans
- Metadata: Agent ID, session ID, run ID
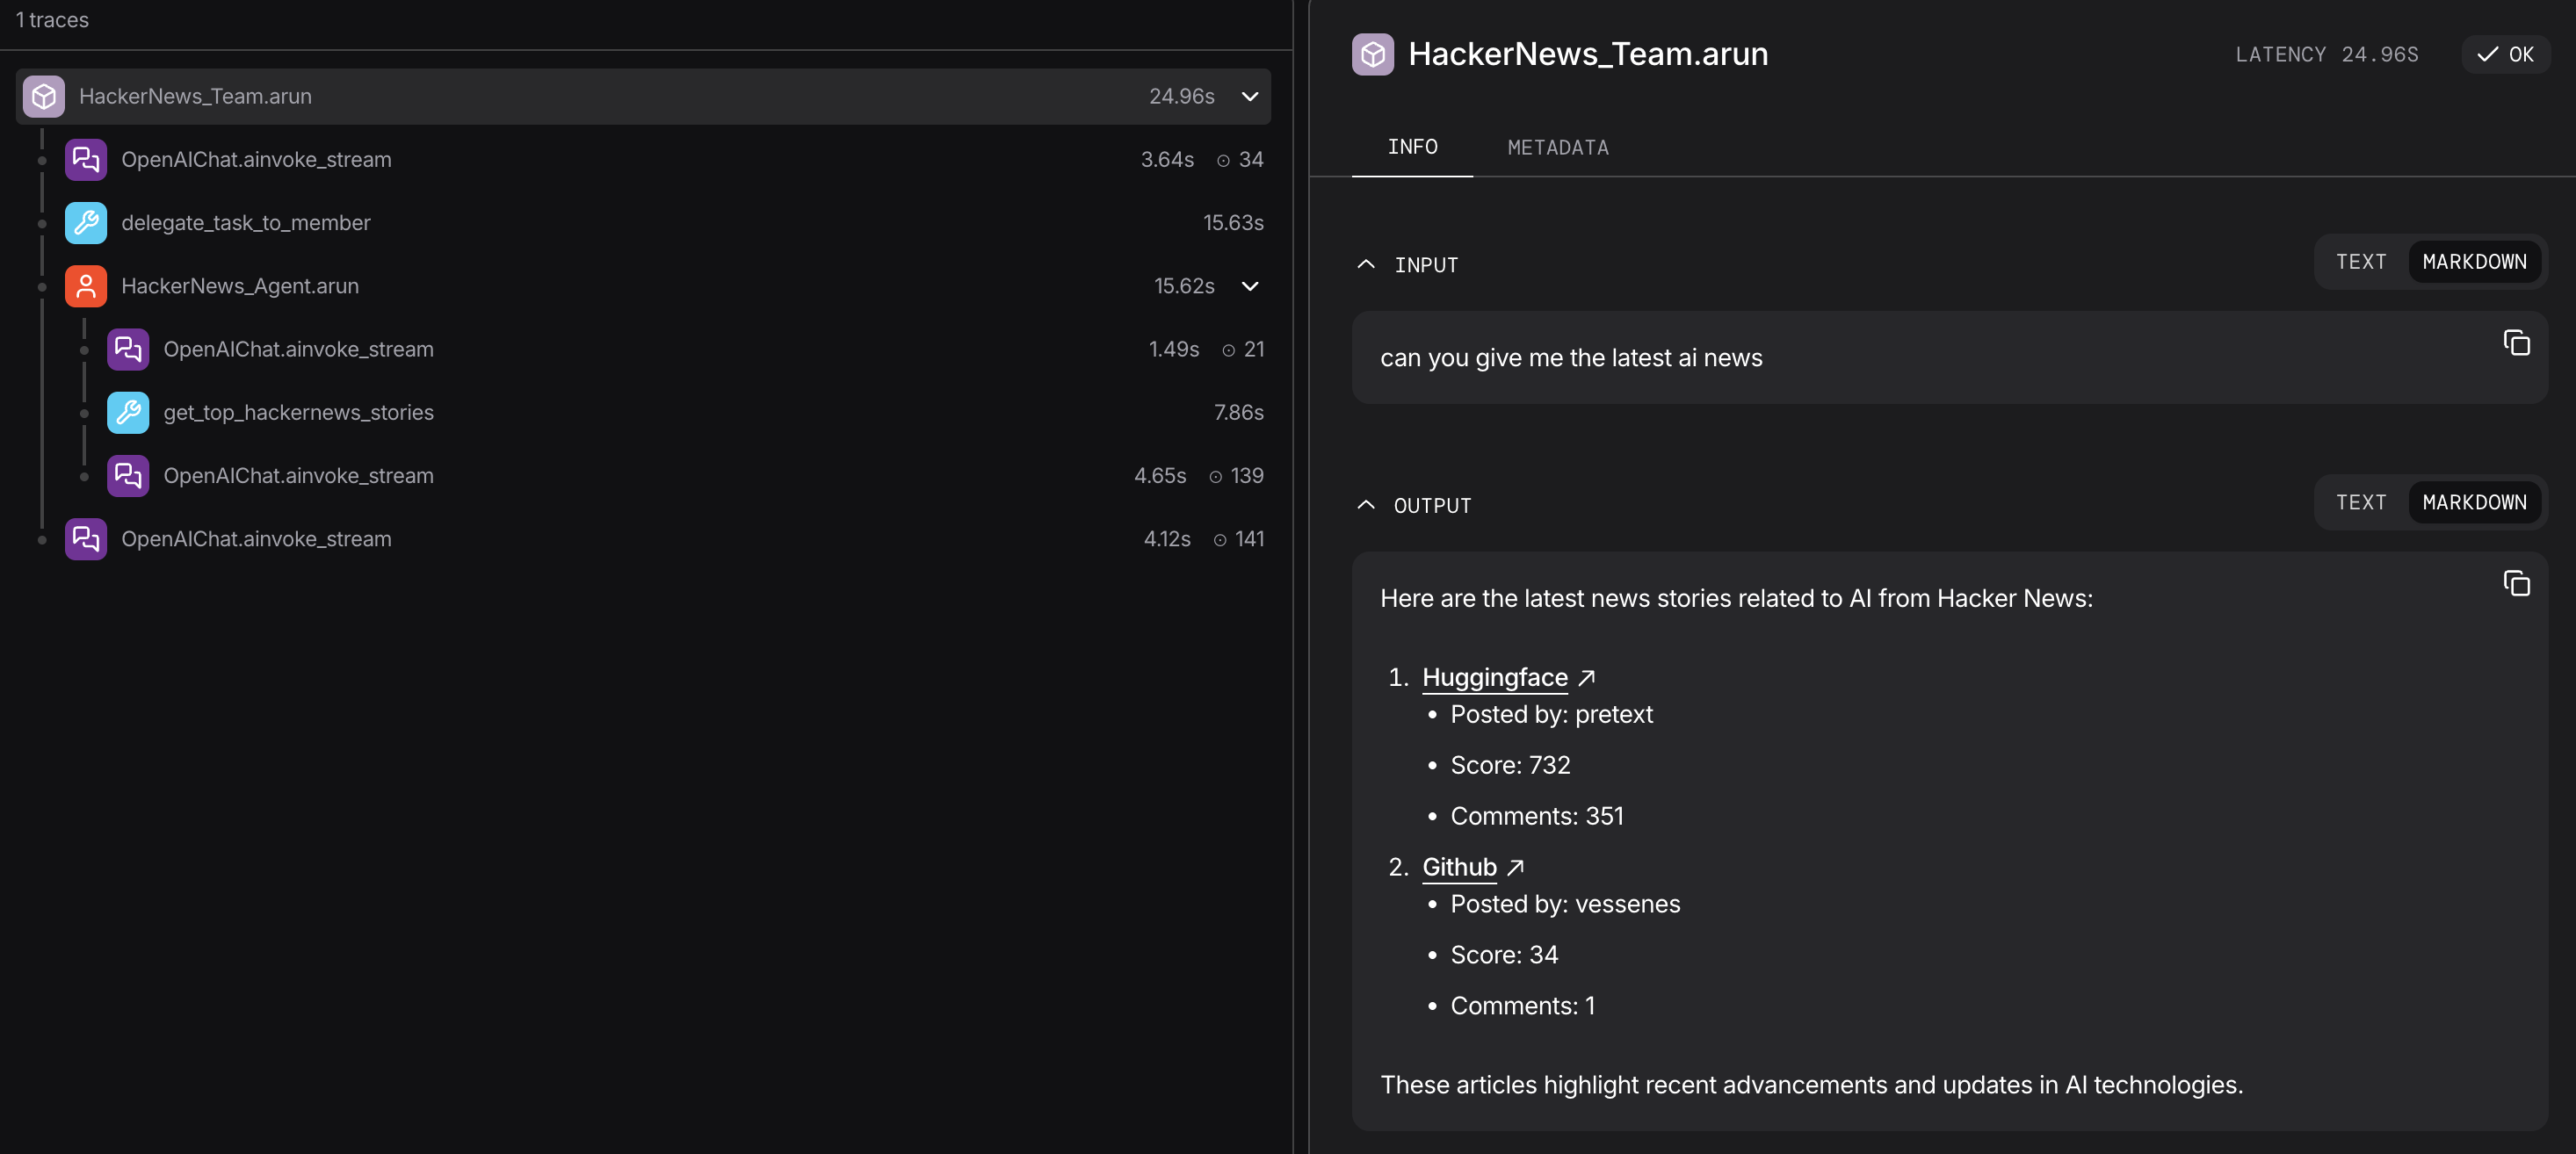
What Gets Traced
Agno automatically captures:| Operation | What Gets Traced |
|---|---|
| Agent Runs | Every agent.run() or agent.arun() call with full context |
| Model Calls | LLM interactions including prompts, responses, and token usage |
| Tool Executions | Tool invocations with arguments and results |
| Team Operations | Team coordination and member agent runs |
| Workflow Operations | Workflow coordination and step runs |
Key Features
- Zero-Code Instrumentation: No need to modify your agent code
- Database Storage: Traces stored in your Agno database (SQLite, PostgreSQL, etc.)
- Flexible Querying: Filter by agent, session, run, or time range
- OpenTelemetry Standard: Export to external tools like Arize Phoenix, Langfuse
- Non-Blocking: Tracing never slows down your agents
- Configurable: Adjust batch sizes and processing for your needs
Quick Start
Guides
Basic Setup
Configure and enable tracing
Tracing in AgentOS
Trace your agents, teams, and workflows in AgentOS
DB Functions
Query traces and spans from your database