> ## Documentation Index
> Fetch the complete documentation index at: https://docs.agno.com/llms.txt
> Use this file to discover all available pages before exploring further.
# Agent Observability
> Store traces, run history, and audit logs in your own database. Natively in Agno
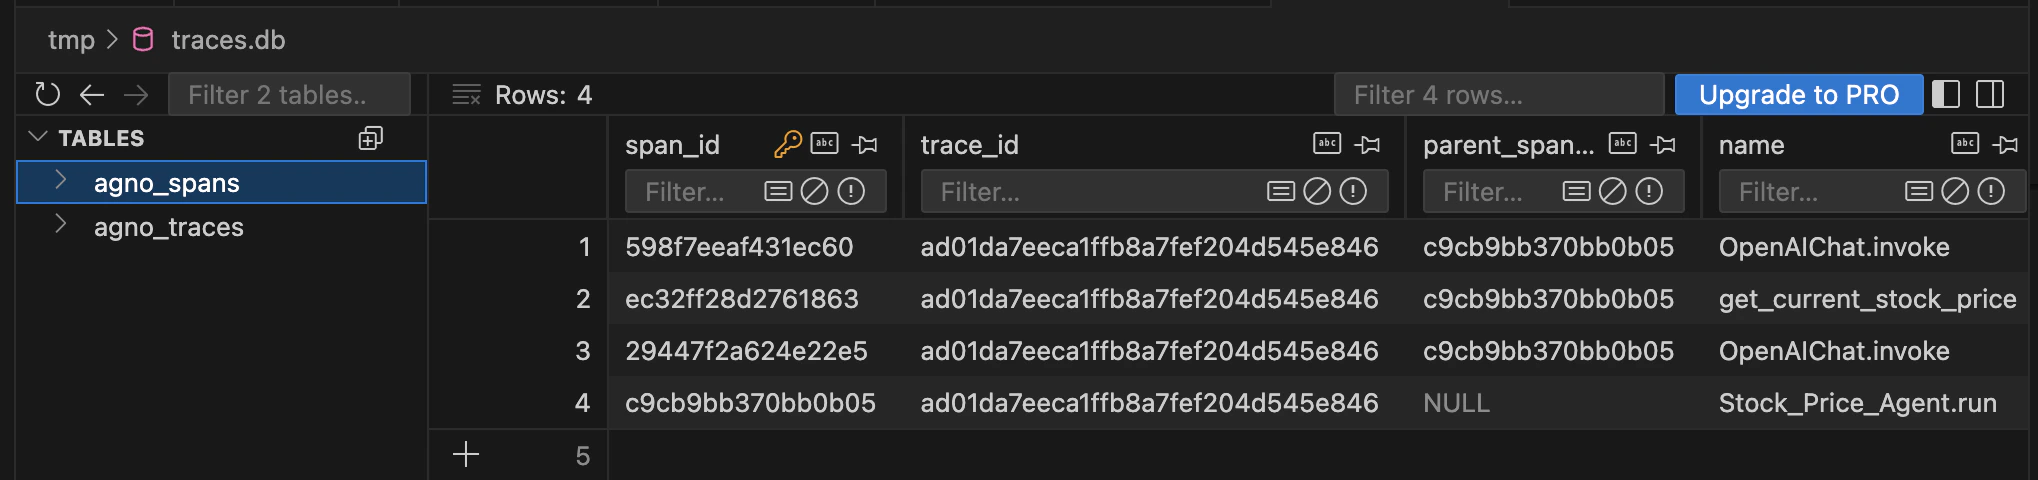
AgentOS comes with a built-in tracing provider that routes every run to your database. There is no external observability SaaS to sign up for, no API key to manage, and no data egress. Your traces live in `agno_traces` and `agno_spans` in the same `db` you already use for sessions and memory.
```python theme={null}
from agno.os import AgentOS
agent_os = AgentOS(
agents=[agent],
db=db,
tracing=True,
)
```
Every run produces a trace tree: spans for the LLM call, each tool, hook, retrieval, and team delegation. Tracing is built on [OpenTelemetry](https://opentelemetry.io/) and instruments your agents with zero code changes.
## Your data never leaves your db
This is the difference between AgentOS tracing and hosted observability platforms.
| | AgentOS tracing | Hosted observability SaaS |
| ----------------- | ------------------------- | ----------------------------------------------------------- |
| Where traces live | Your database | Their servers |
| Data egress | None | Every prompt, tool call, and response leaves your network |
| Vendor dependency | None | Your observability stops if they go down or you stop paying |
| Cost model | Your existing database | Per-seat or per-event billing |
| Querying | Direct SQL on your tables | Their API and UI only |
Prompts, tool arguments, and model outputs often contain customer PII, internal data, and proprietary logic. With AgentOS tracing, none of it crosses your network boundary. You own the data, you control retention, and you can query it with the database tools you already run.
 ## What gets captured
| Span | Attributes |
| ------------------- | ------------------------------------------------------------------------- |
| **Run** | `agent_id`, `user_id`, `session_id`, `model`, latency, status |
| **LLM call** | Model, prompt tokens, completion tokens, temperature, tool calls returned |
| **Tool** | Tool name, arguments, result, duration, exception (if any) |
| **Pre/post hook** | Hook name, duration, modified input/output |
| **Retrieval** | Query, vector store, k, returned docs, scores |
| **Team delegation** | Member name, mode, sub-run trace |
Traces follow OpenTelemetry semantic conventions, so you can query them directly:
```sql theme={null}
-- Top 10 slowest span types by average duration
SELECT
name,
AVG(duration_ms) AS avg_ms,
COUNT(*) AS calls
FROM agno_spans
GROUP BY name
ORDER BY avg_ms DESC
LIMIT 10;
```
## In the AgentOS UI
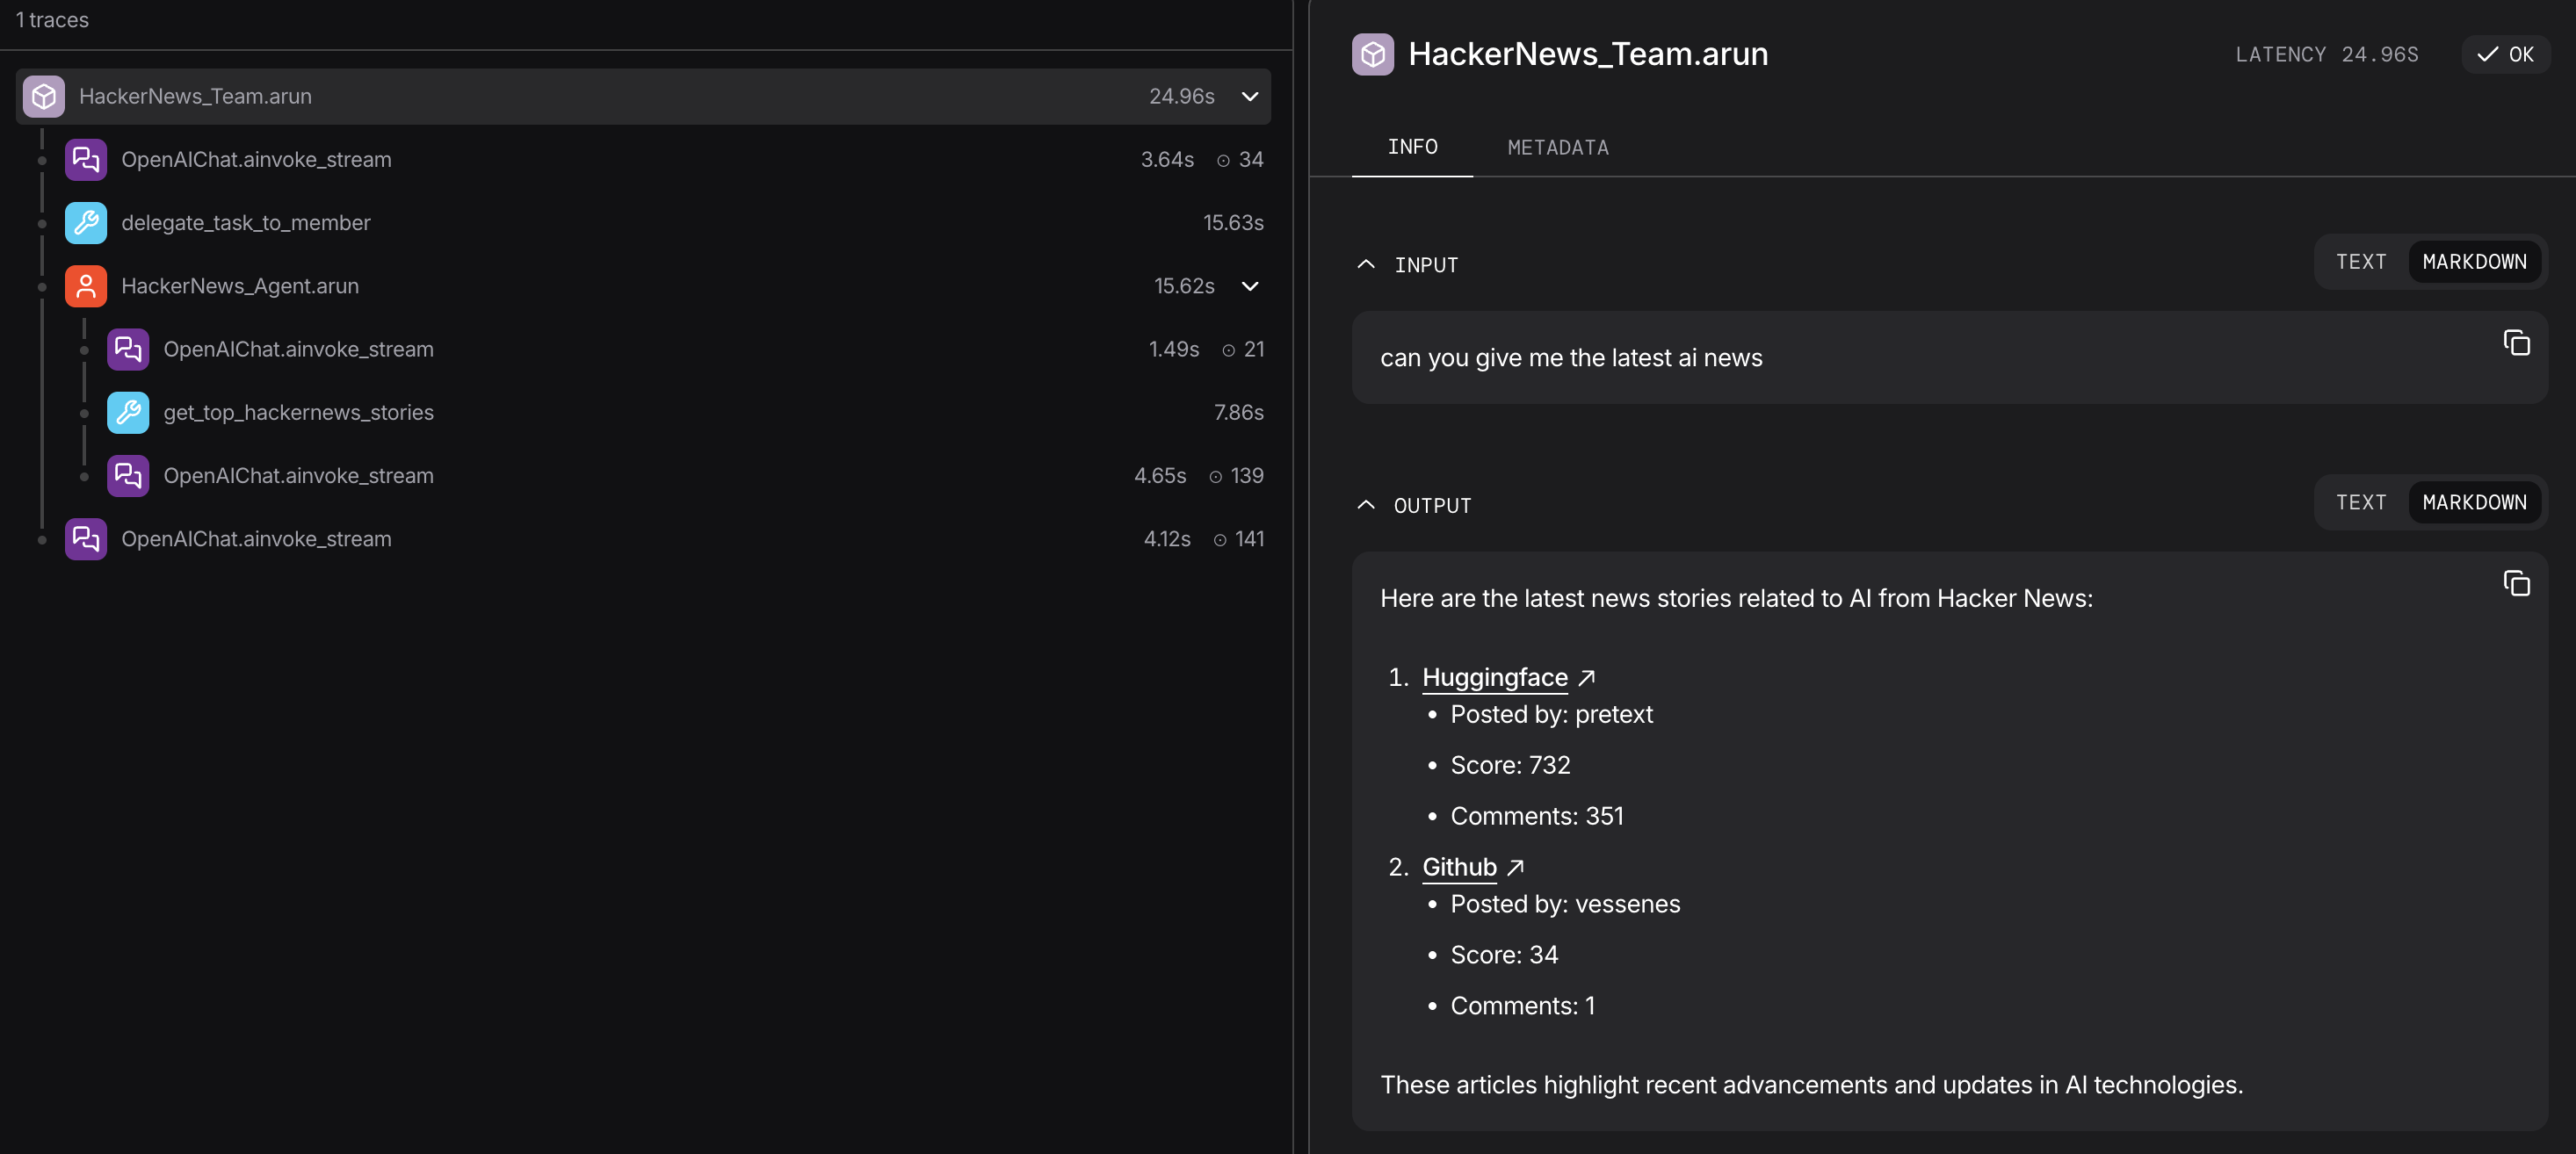
The [control plane](https://os.agno.com) renders the same traces visually. Click a run to see the full tree: LLM hops, tool calls with their inputs and outputs, hooks, and sub-agent traces. Filter by user, session, or time range.
## What gets captured
| Span | Attributes |
| ------------------- | ------------------------------------------------------------------------- |
| **Run** | `agent_id`, `user_id`, `session_id`, `model`, latency, status |
| **LLM call** | Model, prompt tokens, completion tokens, temperature, tool calls returned |
| **Tool** | Tool name, arguments, result, duration, exception (if any) |
| **Pre/post hook** | Hook name, duration, modified input/output |
| **Retrieval** | Query, vector store, k, returned docs, scores |
| **Team delegation** | Member name, mode, sub-run trace |
Traces follow OpenTelemetry semantic conventions, so you can query them directly:
```sql theme={null}
-- Top 10 slowest span types by average duration
SELECT
name,
AVG(duration_ms) AS avg_ms,
COUNT(*) AS calls
FROM agno_spans
GROUP BY name
ORDER BY avg_ms DESC
LIMIT 10;
```
## In the AgentOS UI
The [control plane](https://os.agno.com) renders the same traces visually. Click a run to see the full tree: LLM hops, tool calls with their inputs and outputs, hooks, and sub-agent traces. Filter by user, session, or time range.
 ## Multi-database tracing
Traces are high-volume and write-heavy, with a different cost profile, retention, and access pattern than sessions. For production, route them to a dedicated database by pointing the AgentOS `db` at it:
```python theme={null}
from agno.agent import Agent
from agno.db.postgres import PostgresDb
from agno.os import AgentOS
# Each agent keeps its own database
agent_db = PostgresDb(db_url="postgresql://primary/...")
# Dedicated database for traces
trace_db = PostgresDb(db_url="postgresql://traces/...")
agent = Agent(name="Research Agent", model=..., db=agent_db)
agent_os = AgentOS(
agents=[agent],
db=trace_db, # All traces are written here
tracing=True,
)
```
The AgentOS `db` is where traces land. Keeping it separate isolates trace write volume from your agent data and gives you independent retention and scaling.
See [Multi-DB tracing](/agent-os/tracing/usage/tracing-with-multi-db-scenario) for the `setup_tracing()` variant with batch tuning.
## External providers
If you already run an observability platform, AgentOS can export to it instead of (or alongside) your database. Add an OpenTelemetry exporter to send traces to Langfuse, Langsmith, Arize, Logfire, MLflow, or any OTel endpoint.
See the [Observability section](/observability/overview): [Langfuse](/observability/langfuse), [Langsmith](/observability/langsmith), [Arize](/observability/arize), [Logfire](/observability/logfire), [MLflow](/observability/mlflow).
## Developer Resources
* [Tracing overview](/tracing/overview)
* [Tracing in AgentOS](/agent-os/tracing/overview)
* [Query traces from your database](/tracing/db-functions)
## Multi-database tracing
Traces are high-volume and write-heavy, with a different cost profile, retention, and access pattern than sessions. For production, route them to a dedicated database by pointing the AgentOS `db` at it:
```python theme={null}
from agno.agent import Agent
from agno.db.postgres import PostgresDb
from agno.os import AgentOS
# Each agent keeps its own database
agent_db = PostgresDb(db_url="postgresql://primary/...")
# Dedicated database for traces
trace_db = PostgresDb(db_url="postgresql://traces/...")
agent = Agent(name="Research Agent", model=..., db=agent_db)
agent_os = AgentOS(
agents=[agent],
db=trace_db, # All traces are written here
tracing=True,
)
```
The AgentOS `db` is where traces land. Keeping it separate isolates trace write volume from your agent data and gives you independent retention and scaling.
See [Multi-DB tracing](/agent-os/tracing/usage/tracing-with-multi-db-scenario) for the `setup_tracing()` variant with batch tuning.
## External providers
If you already run an observability platform, AgentOS can export to it instead of (or alongside) your database. Add an OpenTelemetry exporter to send traces to Langfuse, Langsmith, Arize, Logfire, MLflow, or any OTel endpoint.
See the [Observability section](/observability/overview): [Langfuse](/observability/langfuse), [Langsmith](/observability/langsmith), [Arize](/observability/arize), [Logfire](/observability/logfire), [MLflow](/observability/mlflow).
## Developer Resources
* [Tracing overview](/tracing/overview)
* [Tracing in AgentOS](/agent-os/tracing/overview)
* [Query traces from your database](/tracing/db-functions)